
Graphic Elements
Our official graphic elements offer additional visuals that can be used across the Johns Hopkins University enterprise.
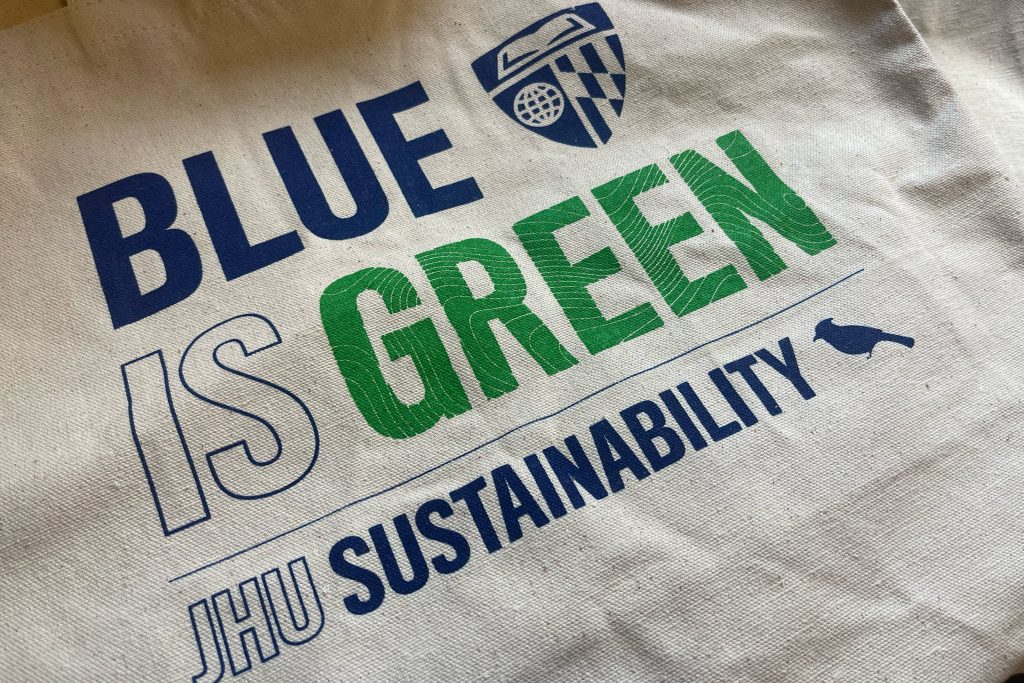
Patterns
Inspired by the four words rooted in our logo architecture, our graphic patterns offer a shared visual texture across Johns Hopkins University.

Research
We believe curiosity inspires innovation. That’s why, for more than 40 years in a row, we put more money into research than any other U.S. academic institution.

World
The fabric of our university is woven together by people from across the globe. We use that collective knowledge to address our world’s most complex challenges for the betterment of society.

Excellence
We believe that excellence is not a destination but rather a journey. We are committed to continue to explore, reach new peaks, and share the knowledge we gain along the way.

Community
Like the contrasting elements of the Baltimore crest, we must foster unity even where we have dividing lines.
Pattern Use Guidelines
These patterns have a wide variety of subtle uses to explore—combined with photographic and other design elements, used as background textures and environmental graphics, cropped and layered for depth. However, intentionality remains paramount, and patterns should never be used without purpose.
Color
Background and stroke colors can be changed to approved brand colors. Primary blue colors are encouraged for backgrounds and white is encouraged for strokes. Gradients are also approved for both use cases.
Stroke Weight
Stroke weight can be adjusted as needed per application (ex. stage display backgrounds require thickened stroke weight for visibility), but stroke weight should remain subtle in the application so as not to complete with layered elements.
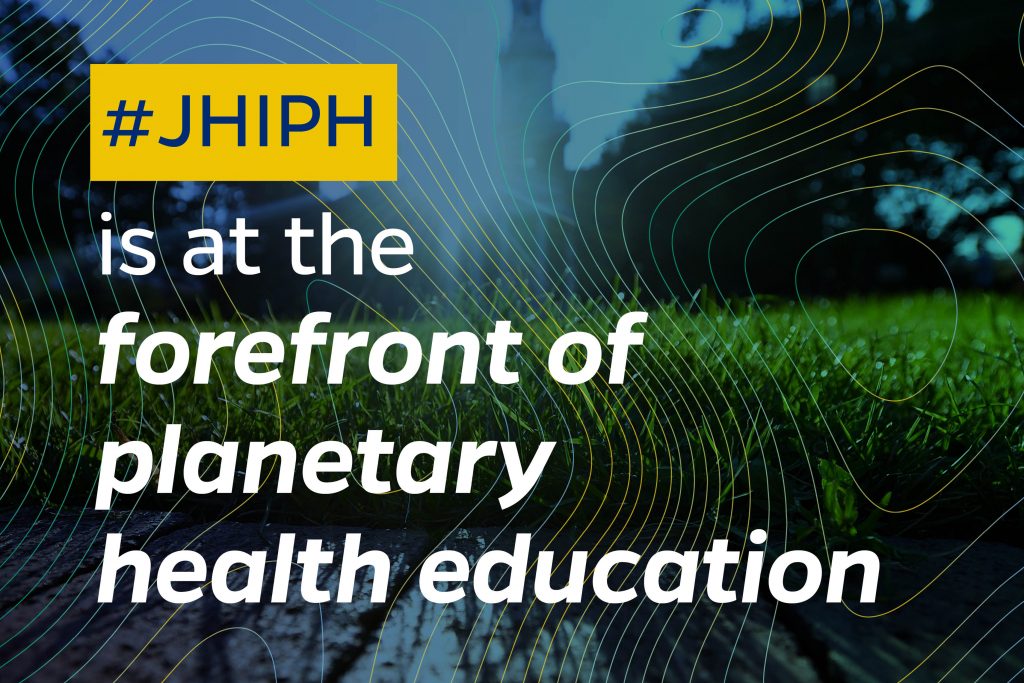
Opacity
Pattern opacity should be reduced when used behind type or logos. Gradient feathers can be applied in these instances. Additionally, opacity adjustments and gradients can be employed when layering patterns over photographs.

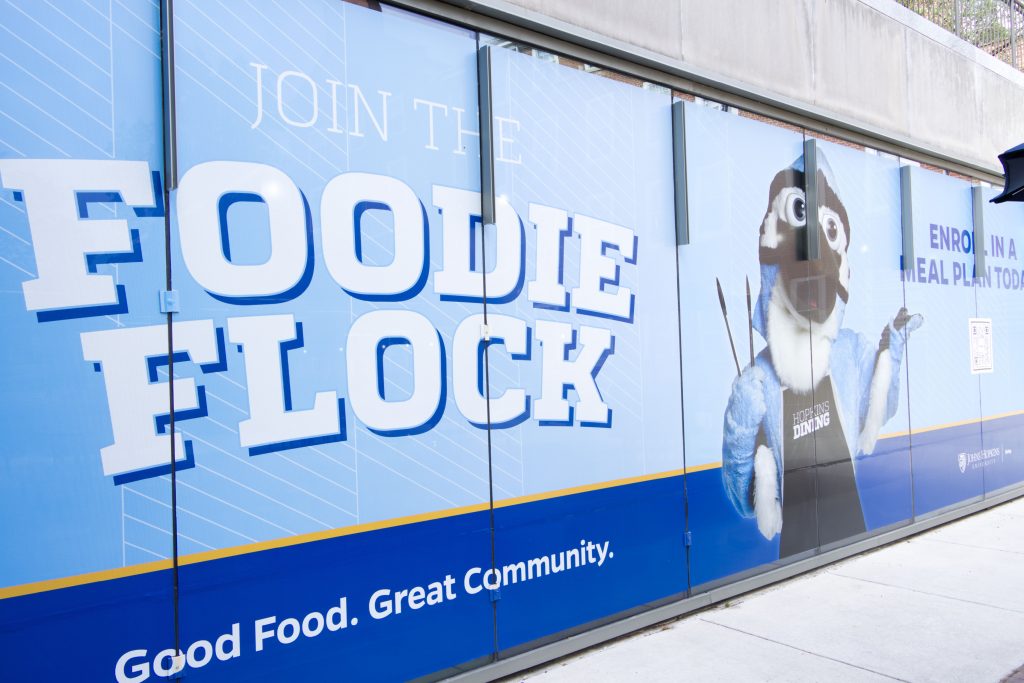
Birds of a Feather Pattern
For special spirit use-cases, such as Blue Jay Tuesday, our Birds of a Feather pattern is available for use. As this pattern is reserved for limited use, please contact University Communications for access.
Request Feather PatternIcons
The Johns Hopkins University icon set helps communicate keywords or topics in your marketing materials. This collection continues to grow, and expansion packs for wellness, sustainability, and community are available upon request. If you have suggestions for new icons, please email [email protected].
Note: Icons are not logos and must not be used in conflict with or in place of official logos.
Web Icons
In addition to the custom icon set provided above, we recommend using supplemental iconography from Font Awesome on all sites within the jhu.edu domain. This iconography is best suited for quick, informative purposes, where adding a visual serves more of a functional purpose, rather than decorative.
Data Visualization
Visualizing complex data sets adds interest, but it also makes for more digestible content. Brand colors should be used to illustrate hierarchy and differentiate data.
Charts & Graphs
- Use Heritage Blue and Spirit Blue predominantly. Add secondary colors or tonal shades when there are several data points and more contrast is needed.
- Use Gentona for data labels and captions. Quadon can be used for highlighting numbers.
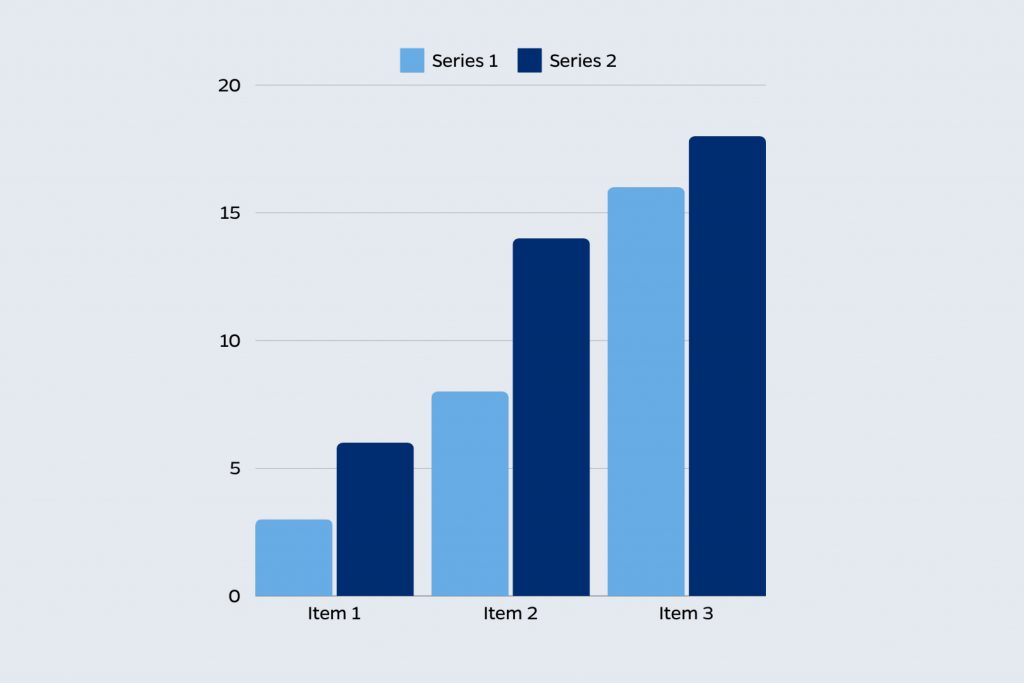
Bar Graph
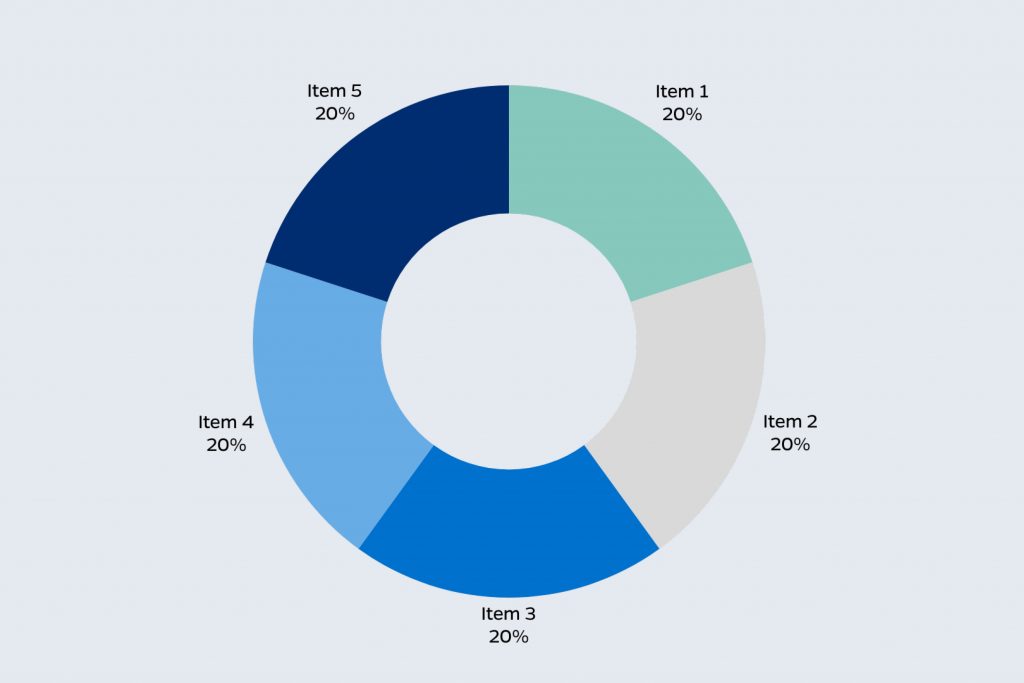
Pie Chart
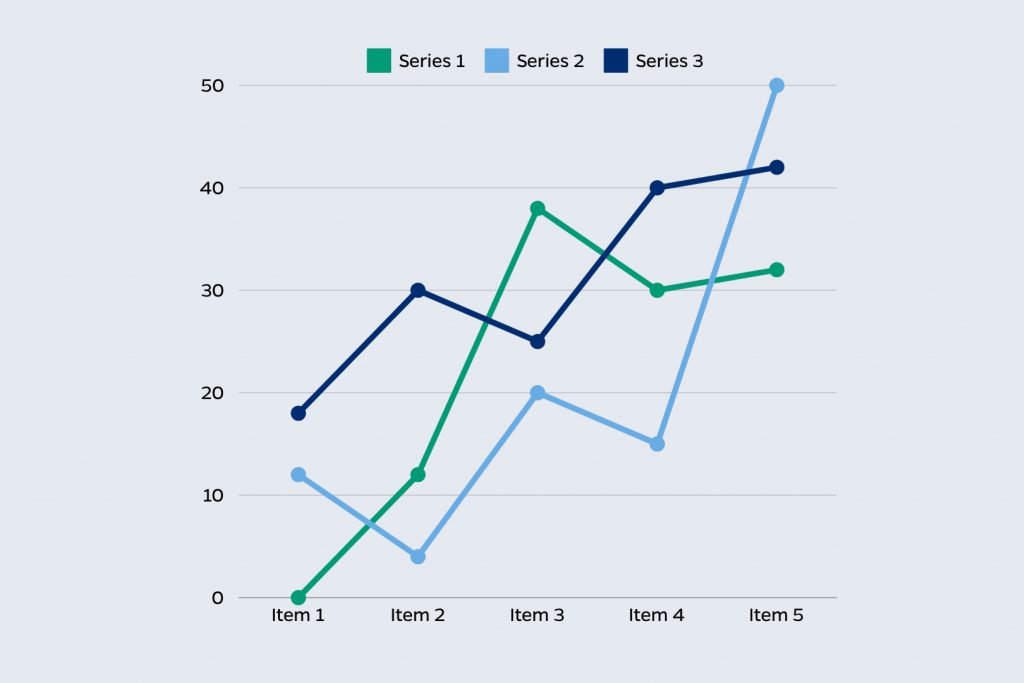
Line Graph
Statistics
Data points break up text-heavy pages and add variety to layouts. These examples offer guidance on highlighting data points, like facts and rankings, in a way that’s clear and visually interesting.
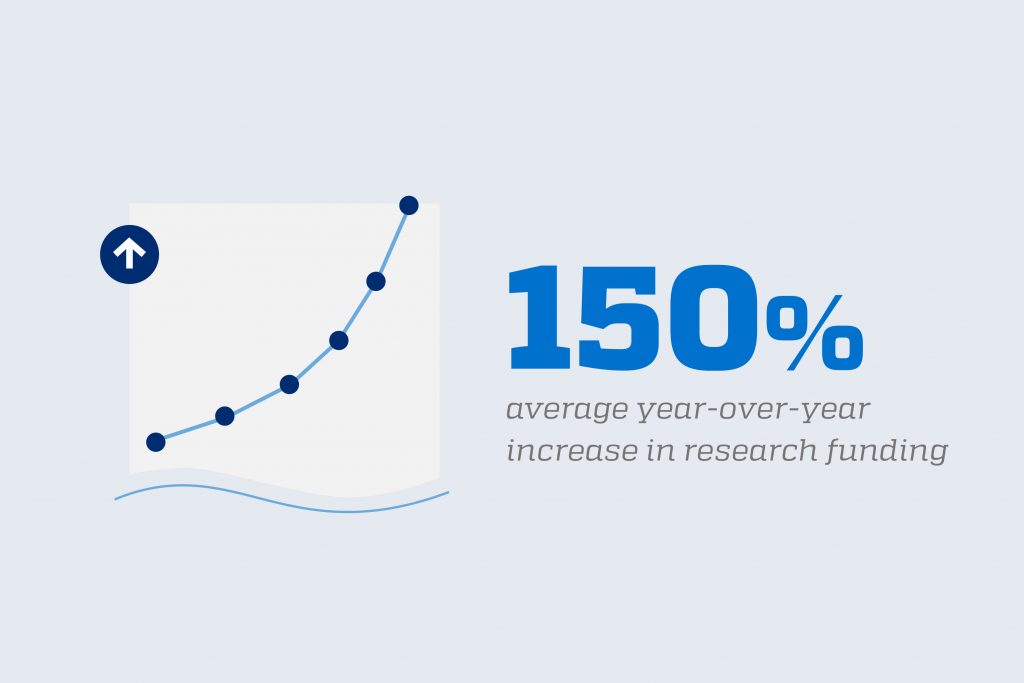
Primary Formatting
Use a simple graph or icon to depict an image related to the data point.
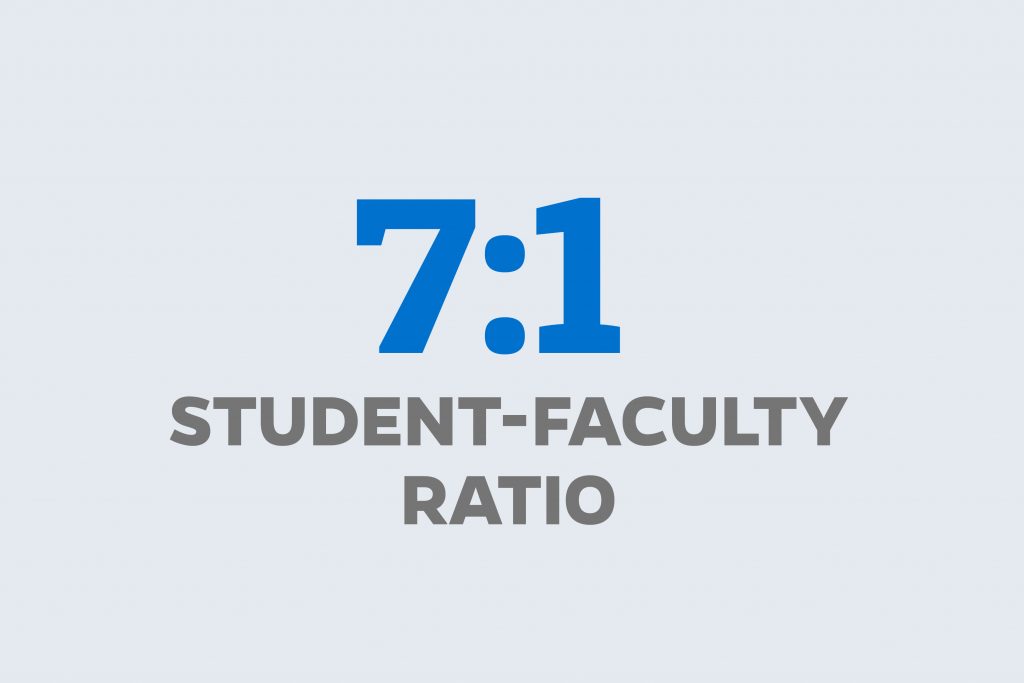
Text-Only Formatting
Highlight data points as large bold text with smaller text used to explain the larger data point.
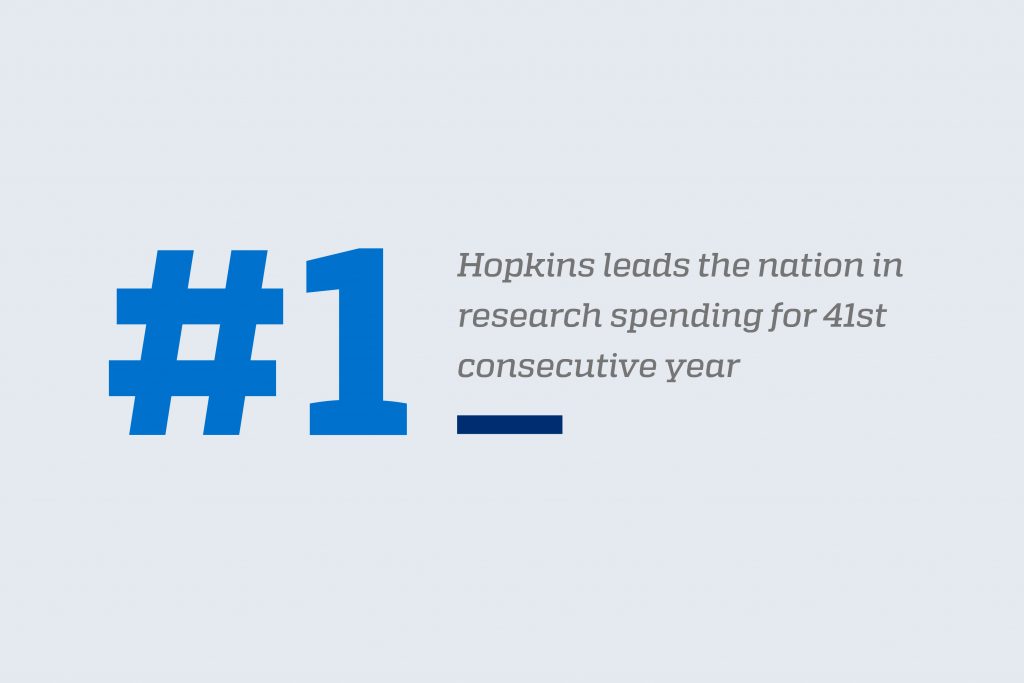
Longer Description
A longer description can be placed next to the data point in smaller text with a rule. Elements from the primary formatting can be included.